The latest release of Scrumpy Planning Poker is focused on the different types of card types for estimation. With this release, the application now supports different type of cards and custom story points mapping that can fit every case like Fibonacci and T-Shirt story sizing.
New features
The new features were carefully crafted according to the Feature Requests page and the received up-votes.
Selecting cards sequences
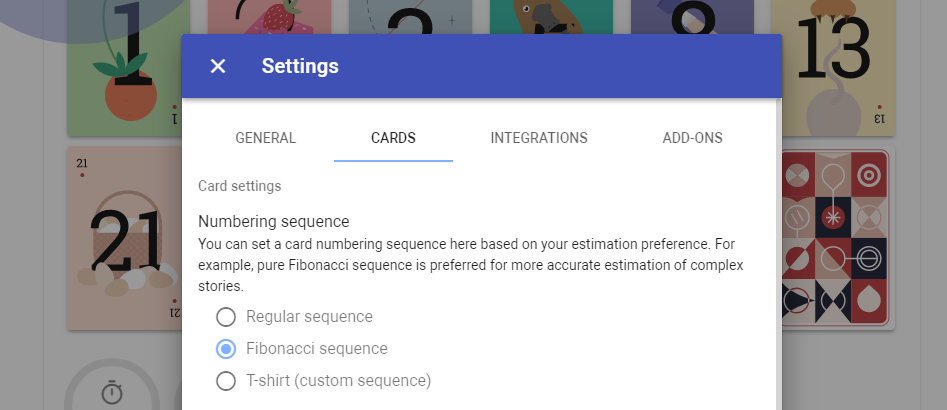
Before, there was only one type of card sequence – 0,0.5,1,3,5,8,13,20,40,100. From the settings page, now you can select a few more sequences which have a different purpose. For example, the Fibonacci sequence is more accurate when estimating more complex tasks, while the T-Shirt estimate is not bound to points and can have a custom mapping from a T-shirt to story point.
The sequence can be chosen at any time from the Settings page. The Settings page can be open only when there is no current voting session.
Custom card sequence
Real Fibonacci sequence
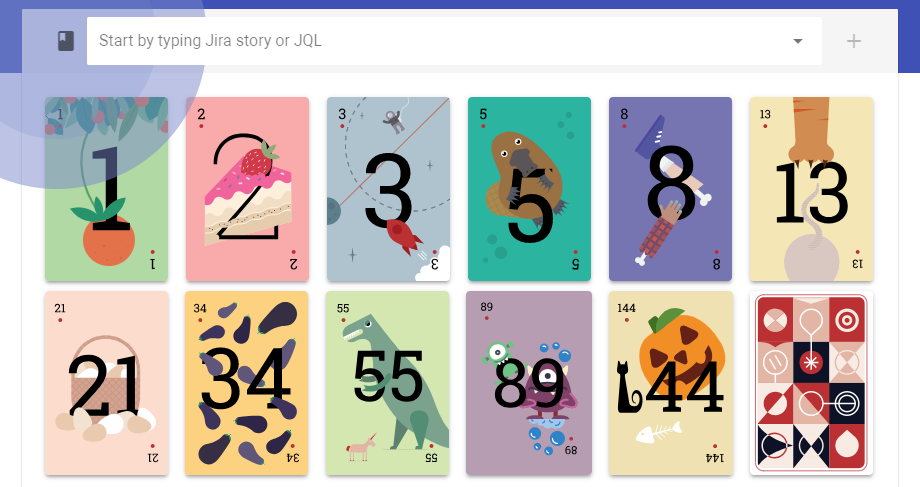
Before, Scrumpy Planning Poker used only the most commonly used cards for estimation, which partly resembled a Fibonacci sequence, but was not exactly this. Now, the real Fibonacci sequence of 1,3,5,8,13,21,34,55,89,144 is available.
Fibonacci sequence cards
The Fibonacci sequence is more convenient when estimating more complex tasks which are above the regular 1-13 set of estimates.
T-shirt story sizing
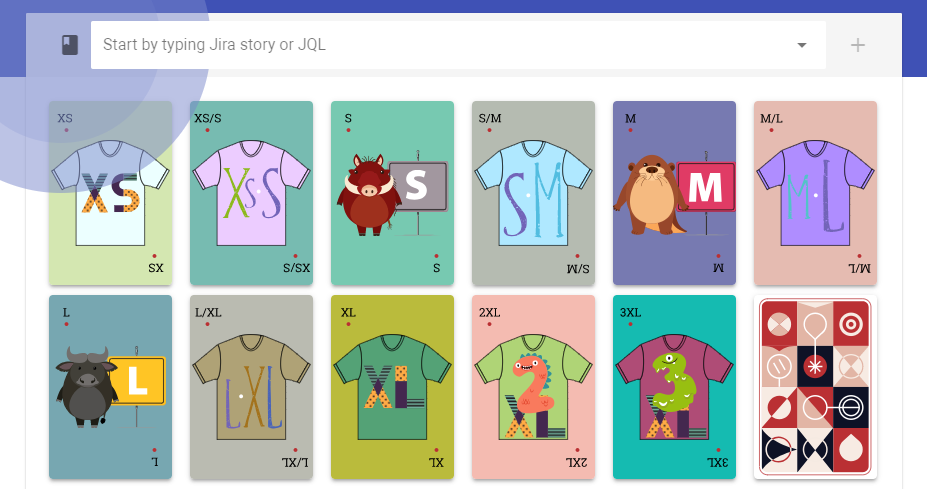
The T-Shirt story sizing is convenient when stories are not visually bound to story points, but to T-shirt sizes. This way the voters evaluate tasks by small/big scale without thinking about the story points. This card sequence allows custom mapping to any type of ascending story points. The scale can be linear, progressive, exponential or anything that fits the project.
T-Shirt story sizing
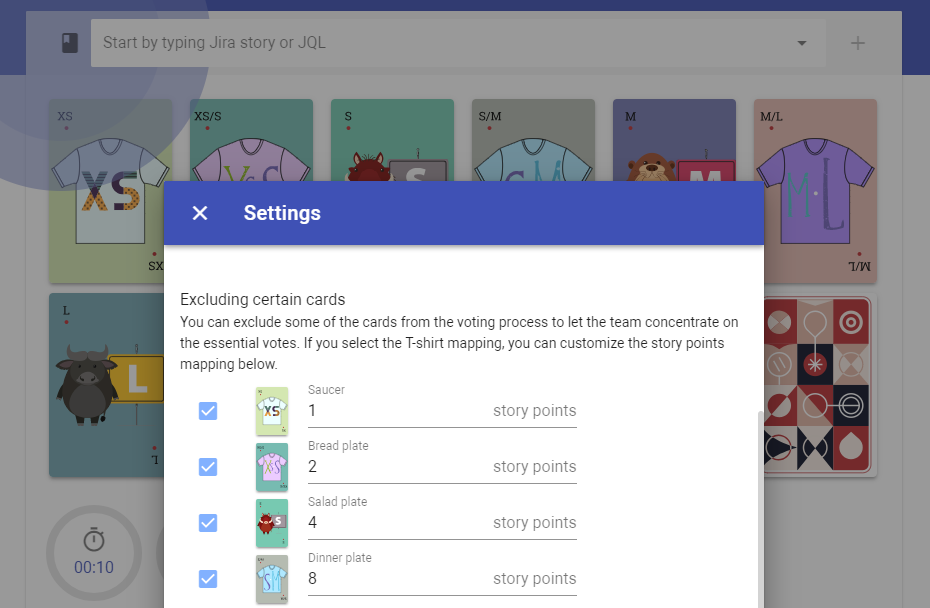
The adjusting of the mapping from a T-shirt to story points is available in the Settings page. Note that only ascending mappings is supported, e.g. the cards must be ordered from small to big.
Custom T-Shirt story sizes
Happy voting!
All those nice features have been implemented thanks to our users – they have requested and we have implemented them. Please help Scrumpy Planning Poker become even more convenient for you by submitting a feature request to our Feature Requests page or up-vote an existing feature that you find useful. Thank you!
An important aspect of project management is properly estimating the project’s release date. But how can you be able to predict at what date exactly, a big complex system can be delivered?
The estimation problems
To be able to deliver a project on time, the delivery date has to be properly calculated based on the correct tasks estimation. Estimating the tasks is usually a tough process, especially when you have to work with time-based metrics and provide an exact period in which a task should be completed. From a psychological point of view, committing to time for implementation of a task is hard and always prone to failure.
The problem with time
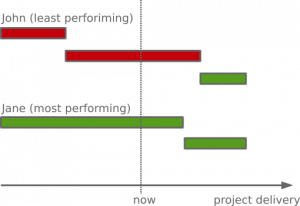
The reason why estimating time is problematic is relatively simple – the more complex the task is, the bigger the chance of not meeting the deadlines. On top of that, it really depends which team member picks which task. People in the team have different velocity and deliver a different volume of work. Due to the changes in the availability of different team members (vacations, training, etc.) sometimes a task estimated by the most performing team member can end on the desk of the least performing one. Then the nice Gantt charts become a mess – tasks become overdue and managers are always concerned if the project will be completed in time.
Broken Gantt chart
The resistance against time estimates
When implementors of a task are asked to give an estimate, there is always a resistance – if the estimate is not met then who is to blame? Also, when a task estimated by one team member lands for some reason on the desk of another team member, who is to blame when the estimate does not match the actual time spent?
All this leads to an unwillingness among team members to estimate tasks. This resistance creates difficulties for the management to properly estimate the delivery dates.
Using story points
There is an alternative approach to using time-based metrics for estimating tasks – using story points. The story point is not a fixed unit of work, but an exponentially growing relative estimate. The estimates are given by the whole team during the refinement sessions.
Example estimates
Sharing responsibility
By using story points, the whole team gives an estimate for each task. The estimate is accepted when all team members agree on it. This saves the discussion later who estimated it and how much time was actually needed to complete the task. There was an initial agreement between team members and responsibility is shared.
Estimating complexity
Story points are used to estimate the complexity of a task, including its external dependencies and any risk if something might go wrong. Since it is not a commitment to a physical metric like time, such estimates are given with ease by the team.
The smallest estimate
Since story points are relative, there must be an anchor from which to start. The anchor for the relative estimation is the smallest unit of work that requires some implementation effort. This is the least volume of work which the team is able to estimate.
The lowest estimate
The biggest estimate
Story points are exponentially growing to indicate that the more complex a task is, the more difficult it is to estimate it. Story points can grow up to the ∞ (infinite) estimate. The infinite estimate though is rarely used. The biggest estimate should be the largest unit of work that can be implemented by one team member on the average for one sprint. And the length of the sprint itself is evaluated by the biggest unit of work that can be done by a person on the average without losing control on the task.
The stories that are bigger than the biggest estimate
Some tasks are estimated by the team with higher story points than one person can implement within a sprint. Placing such tasks in a sprint will cause carryover. Carryovers are not good as they leave the feeling that the sprint is not complete and the job is not well done. To avoid this, tasks that are estimated higher must be split apart into smaller units of work and estimated again.
Splitting 13 story points
The story points velocity
The velocity can be measured in average story points per person per time actually spent on tasks (availability). The capacity is a metric for the volume of work a team can do for a given time based on its velocity.
capacity = velocity * availability
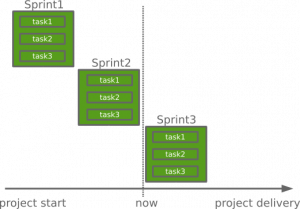
This metric can be converted to time and the release date correctly estimated. When the velocity is predictable, the project’s release date can be punctually estimated. Based on story points and sprints, the new fixed and predictable Gantt chart would look like this:
Fixed Gantt chart
The tooling
The Scrumpy Planning Poker application is a useful free tool that allows estimating tasks in a collaborative way both by colocated and distributed team members following the Planning Poker rules. The refinement session is lead by the Product Owner (PO) or the Scrum Master (SM). You can start your first Scrumpy Planning Poker session right away!